Congratulations, you’ve just uploaded a video to the internet! You might just be steps away from being invited by James Corden to talk about your zanny video!
Hopefully things go that way for you, but if not then how should you feel about your video views and engagement metrics? Obviously the more views the better, and you probably have a gut sense of what success looks like. But what about user engagement? The likes, shares, comments and god forbid… dislikes [dramatic music]. 100% of your moms will like the video, but then there are the other 7 billion humans, and a handful of crafty chimps to contend with…
So what level of engagement is normal? What benchmarks can help to understand viewer sentiment on a particular platform or style of video?
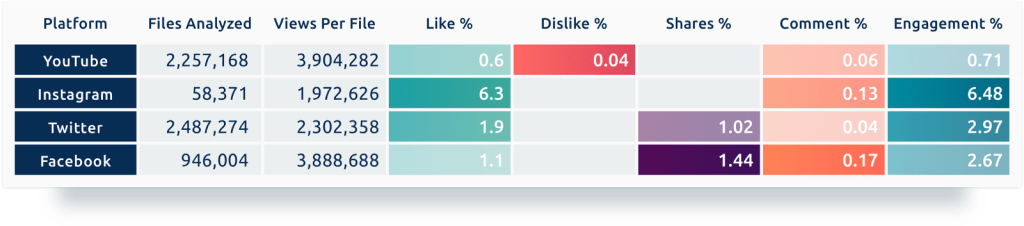
We leveraged Pex’s unprecedented access to video data across the web to quantify the norms for video engagement across the major social networks. We examined nearly 2 billion unique videos and songs uploaded across 18 audiovisual sharing platforms. Here are the results from ‘The Big Four’ (YouTube, Instagram, Twitter, and Facebook):

Not all likes are created equal
People are liking videos on Instagram as if it was going out of style. More than 1 out of 10 viewers of an Instagram video will leave a like before moving on, which is an astronomical percentage given that on YouTube, less than 1 in 100 viewers will drop a thumbs up on average. This seems to confirm the social nature of Instagram, as opposed to the media-like consumption of YouTube videos by its users. Of course if you are looking at views per video, the average YouTube video has 16 times more views than the typical Instagram video. In terms of viewership, YouTube still dwarfs Instagram.
So if you’re pulling down 2 likes per 100 views on YouTube, or 3 likes per 100 on Twitter or Facebook, you should feel great. You’re doing twice better than average on those platforms. But if you’re only getting 5 likes per 100 views on sites like Instagram then you need to step up your game, or step up your friends.
Sharing is caring
Twitter, Facebook and a handful of other sites offer a ‘share’ feature enabling users to repost content for their connections to see. So on which platform should you expect the most shares? Facebook has the highest rate of sharing as 1.25% of video viewers opt to share the video. That is 1.6 times more common than a Twitter user opting to retweet a video.
Chatty Cathies
Instagram, Mixcloud, OK.ru, and Facebook. These four platforms all have the highest rate of comments (Not shown on the table are Mixcloud’s 0.39, and OK.ru’s 0.24 comment %). So if you’re looking for light banter then head on over to those sites. We’re sure the conversations will be reasoned and balanced.
Viewstyles of the Rich and Famous
After reflecting on our overall findings, we decided to see if these norms changed for the most popular videos. Do users engage differently with blockbuster content? Here is the same table, but only videos with over 1 million views are considered.
The bigger the views, the more viewers snooze
Across all 17 sites analyzed other than Twitter, users engage 22% less with 1M+ view count videos than they do with the average video. Twitter is the lone platform bucking this trend. It actually shows more activity on all engagement metrics leading to 34% more overall engagement than the average Twitter video.
Facebook too shows 13% less engagement overall on 1M+ videos thanks to sharp declines in likes and comments. Sharing, however, does increase on Facebook as users are 15% more likely to share 1M+ view count videos.
Haters Ball
The only thing people love more than love is hate. If we focus on YouTube, which category of videos has the most haters?
Below is the same breakdown but now aggregating sentiment by category for 720 million YouTube videos (roughly 10% of all videos on the site). To clarify the haters strength, we’ve added a metric we will call the “Sidious Ratio”. Named after Darth Sidious aka Emperor Palpatine who famously taught us to “let the hate flow through you”. Sidious Ratio = Dislikes/Likes aka how many dislikes you get per like aka how close you are to the dark side.

Jar Jar Binks Award
In the least shocking analytical conclusion of all time – the award for most hated YouTube category goes to News & Politics. It has a Sidious Ratio of 0.15 meaning for every 100 likes found in News & Politics, there are 15 dislikes. That’s over 2x more hateful than the YouTube average.
“Goooooood” — Darth Sidious
Game On
Gaming videos have by far the most engagement of all YouTube channels. And in one respect, videos in the Gaming category are just as hateful as News & Politics. They both have 0.08% of viewers leaving dislikes. Tied for the most hate per views of all categories. However Gaming, unlike News & Politics, has a massive amount of likes left on their videos as well. Gaming actually receives the most love with 1.9% of viewers leaving a like. So despite the hate, Gaming actually has the lowest Sidious Ratio because the haters are being drowned out by the lovers. How beautiful.
Lastly, the award for the category with the lowest engagement goes to Autos & Vehicles, with only 0.52% of views resulting in a like, dislike, or comment. No need for small talk, let’s get back to wrenching.
Those are just a few of our takeaways. What do you take away from this data? Pex is here to pull back the curtain on activity surrounding audiovisual files across the net, so let us know what you think and we can dig into your questions in a future post!