Recently, the Infrastructure Team at Pex had the pleasure and challenge of shifting all of our deployments from Google Cloud Platform (GCP) to Microsoft Azure.Our services rely heavily on Apache Pulsar and we use the number of messages in various queues as the primary source for auto-scaling our various components.
Many cloud platforms offer the ability to perform scale-in or scale-out operations based on a predefined set of metrics as well as some custom metrics.When we went through the process of evaluating Azure VMSS (Virtual Machine Scale Set) features as compared to GCP Managed Instance Groups, we identified two gaps that would need to be bridged for us to migrate successfully.
Over a couple of months of discussions with the Microsoft Azure VMSS Engineering team, we successfully bridged one of the gaps, which was being able to divide the auto-scaling metric by the number of instances for performing scale-in or scale-out events.With this feature in place we would be able to, for example, take a count of how many messages were in a queue and divide that by the number of messages that we determine a single node in a VMSS can handle, and arrive at the proper number of VM’s to have in the VMSS at any given time. You too can do this with any of the available auto-scaling metrics now!
The second bridge required a bit more thought and work on our part. We needed to find a way to get our message queue metrics from Apache Pulsar, which we run in Kubernetes, into Azure Monitor so that they could be available to auto-scale on.After some searching we arrived, as we often do, at leveraging Telegraf.Some research into various Telegraf outputs yielded exactly what we needed.
How to auto-scale a Microsoft Azure Virtual Machine Scale Set from an external metric source
Telegraf is the swiss army knife of our metrics stack. You can use one of the already developed inputs and outputs, or create your own and it pretty much does the rest. If you need a substantial amount of metrics, Telegraf can easily be scaled to accommodate your project’s needs. For the example below, we will use a Prometheus formatted metric source as that is what Apache Pulsar uses, but any input supported by Telegraf could be used. We’ll then use the Telegraf Azure Application Insights output to push the metrics out to Azure Monitor. Deploying Telegraf is a piece of cake, as we are running Pulsar in Kubernetes.
The following steps should get you autoscaling your VMSS on custom metrics in no time:
1. Create a new Application Insights project within Azure and take note of the instrumentation key, this will be used in the next step.
2. Deploy Telegraf to the source of the metrics. We used Helm, passing in the values illustrated below upon install. See Telegraf’s documentation for further info on deploying to kubernetes via Helm here. If Telegraf runs into permission issues, you may need to adjust RBAC to allow it to scrape the correct pods.
image:
  tag: "latest"
env:
  - name: HOSTNAME
    value: "prom2ai"
config:
  agent:
    interval: "10s"
    round_interval: true
    metric_batch_size: 1000
    metric_buffer_limit: 10000
    collection_jitter: "0s"
    flush_interval: "1m"
    flush_jitter: "0s"
    precision: ""
    debug: false
    quiet: false
    logfile: ""
    hostname: "$HOSTNAME"
    omit_hostname: true
  outputs:
    - application_insights:
        instrumentation_key: "<INSTRUMENTKEY>"
  inputs:
    - prometheus:
        metric_version: 2
        monitor_kubernetes_pods: true
        monitor_kubernetes_pods_namespace: "pulsar"
        fieldpass:
          - "pulsar_msg_backlog"
        taginclude:
          - "topic"
          - "address"
Note the fieldpass and taginclude fields used in the example above. This allows for the filtering of the data before it gets sent to the output, lowering costs and keeping the metric data lightweight
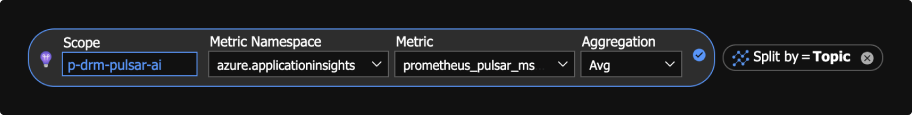
3. To confirm the metrics, go to Application Insights and view your metrics, like so:
4. These metrics should now be available for scaling your VMSS, like so:
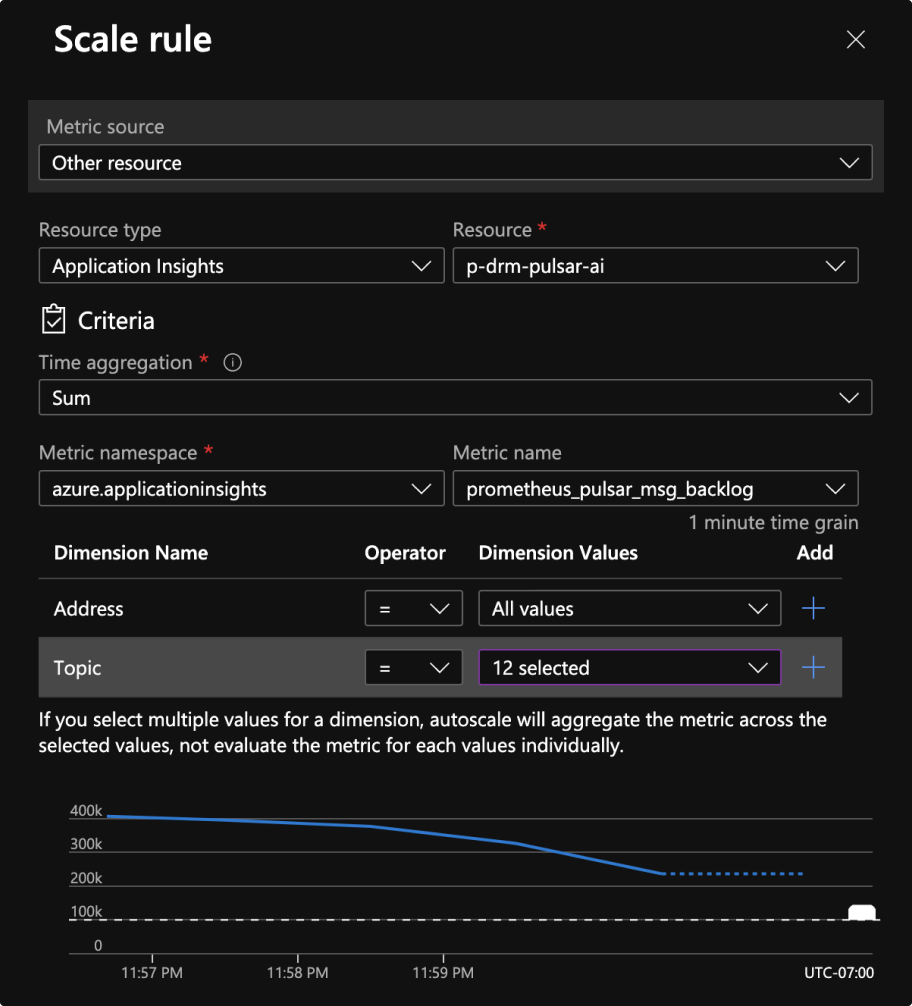
You may also notice that Azure now supports doing arithmetic on auto-scaling metrics in VMSS, which is a feature we requested. With this, you can take the length of a message queue for example, divide by how many messages each one of your worker instances can handle, and scale in and out accordingly. It’s quite a nice feature, and one that we used heavily at GCP.
We have been running this solution in production for over six months now with no issues, and it has allowed us to avoid being tied into – and to scale beyond the limits of – an Azure managed service at a fraction of the cost. We hope this brings some clarity on auto-scaling Azure Virtual Machine Scale Sets from an external metric source.
Want to solve problems like this with us?
We’re hiring! Check out our open positions and if you don’t see anything for you, email us at [email protected]. We’re always looking for new talent to join our team.